Grab your free Sample Sales Data Excel download pack and sharpen your analysis skills with five fully-synthetic Sales & Retail workbooks. Each file mirrors real-world scenarios: regional roll-ups, e-commerce orders, POS receipts, customer histories and inventory levels – yet is 100 % dummy (CC0). Practice PivotTables, Dashboards, Power Query, time-series charts and inventory logic – no sign-ups, no privacy risk.
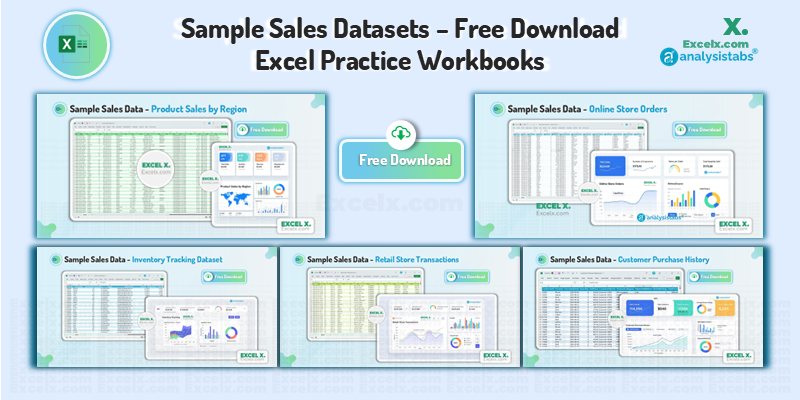
1. Product Sales by Region Dataset
Perfect for executive-level dashboards, this 1 500-row file aggregates sales across five regions and multiple store locations. Analyze how discounts, promotions and payment methods influence revenue, then map results geographically or slice by salesperson. It’s an ideal sandbox for practicing multi-dimensional PivotTables and summary charts in a single afternoon.
Columns Included:
Date,Region,Product,Quantity,UnitPrice,StoreLocation,CustomerType,Discount,Salesperson,TotalPrice,PaymentMethod,Promotion,Returned,OrderID,CustomerName,ShippingCost,OrderDate,DeliveryDate,RegionManager
- Create PivotTables and PivotCharts for regional performance.
- Build dashboards with slicers for discount or promotion filters.
- Plot filled-map charts of revenue by region.
- Compare salesperson performance week over week.
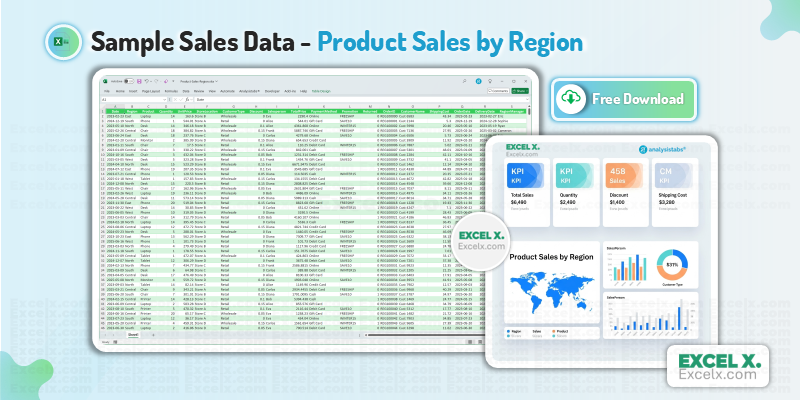
2. Online Store Orders Dataset
This e-commerce table follows every step of an online purchase, from cart creation to delivery tracking. With coupon codes, referral sources and order statuses included, you can quantify promotion lift, evaluate fulfilment speed or join the data to web-traffic logs. Its 1 200 records are compact enough for Excel, yet varied enough for meaningful insight.
Columns Included:
OrderID,Date,CustomerID,Product,Quantity,UnitPrice,ShippingAddress,PaymentMethod,OrderStatus,TrackingNumber,ItemsInCart,CouponCode,ReferralSource,TotalPrice
- Measure promotion effectiveness via
CouponCode. - Track fulfilment stages with
OrderStatus. - Use text functions to parse IDs and addresses.
- Join with customer lists using XLOOKUP.
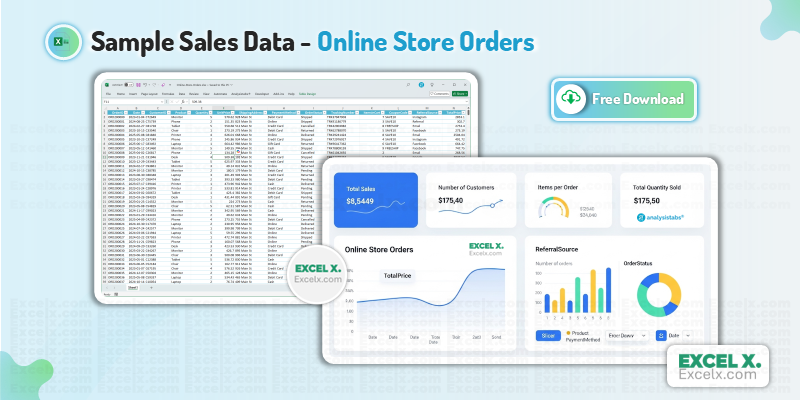
3. Retail Store Transactions Dataset
Dive deep into brick-and-mortar sales with 2 000 POS transactions timestamped down to the minute. The sheet is designed for time-of-day, payment-type and cashier performance analysis. Discover peak shopping hours, assess manager efficiency or highlight best-selling products—perfect practice for anyone learning conditional formatting or CONCAT-based unique IDs.
Columns Included:
Date,Time,StoreID,Location,Product,Quantity,UnitPrice,PaymentType,TransactionID,Cashier,StoreManager,TimeOfDay,DayOfWeek,TotalPrice
- Analyse hourly or daily sales trends.
- Identify top cashiers or store managers by revenue.
- Segment transactions by
PaymentType. - Create CONCAT-based ledger keys for audit trails.
4. Customer Purchase History Dataset
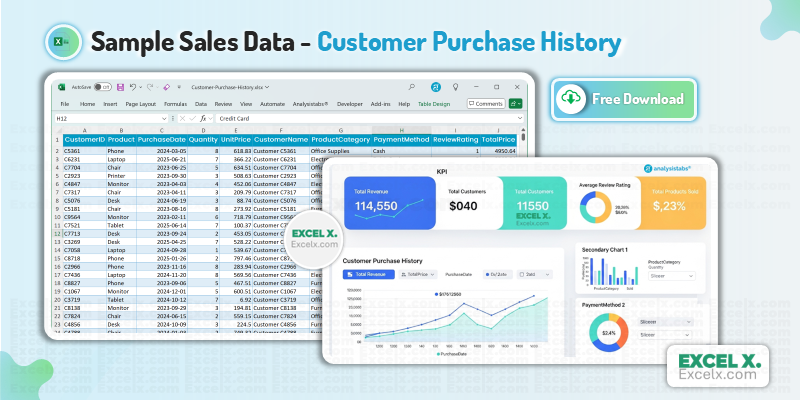
Understand your shoppers, not just your sales. This 1 800-row dataset captures multi-product purchase behavior, payment preferences and review ratings—ideal for cohort analysis and Customer Lifetime Value calculations. Use it to reveal cross-sell opportunities, build “top customers” reports or explore rating-based product popularity.
Columns Included:
CustomerID,Product,PurchaseDate,Quantity,UnitPrice,CustomerName,ProductCategory,PaymentMethod,ReviewRating,TotalPrice
- Calculate Customer Lifetime Value (CLV).
- Rank top customers by spend or rating.
- Analyse product popularity within categories.
- Use PivotTables to find frequently bundled items.
5. Inventory Tracking Dataset
Effective stock management is critical in retail—this 500-row file tracks quantity on hand, reorder points, supplier contacts and unit costs. Practise conditional formatting to flag low stock, compute total inventory value or build supplier scorecards. Combine it with Sales data to estimate safety stock and avoid costly stock-outs.
Columns Included:
ProductID,ProductName,QuantityInStock,ReorderPoint,Supplier,SupplierContact,LeadTime,StorageLocation,UnitCost
- Highlight items below the
ReorderPoint. - Create logical IF statements for stock status.
- Calculate total inventory value by location.
- Build supplier lookup tables with VLOOKUP.
Conclusion: Sample Sales Data & Next Steps
These five Sample Sales Data Excel Downloads let you experiment with every stage of the commerce pipeline—from regional revenue roll-ups to stock-reorder alerts—without risking customer privacy. Download, explore, and build your own dashboards or tutorials. When you’re ready for fresh challenges, head back to the Main Sample Data Library to grab datasets from Finance, HR, Manufacturing and more.
thank you
Happy to help! Enjoy the data!
Best
Thanks you!
thak you
You are welcome! I hope the dataset helps with your project.
So helpful, Thanx!
You’re very welcome! We are glad you found the datasets helpful for your work.
Thank you !
You are very welcome! We are glad you found it useful.
Hi, all this data is related to which company? I would like to know the company name, if possible, please. I need those for my assignment. Would be really helpful..
Hi! All of these are sample datasets and do not belong to any specific company. We generated these records using the most common fields found in sales data. You are welcome to use them for your assignments and practice purposes.
No Product ID attached to other files with the product, so how do I calculate profit? Char belongs to category Furniture at the same time to category Office Supplies with different cost
Thank you for the detailed feedback! You are absolutely right—without the Product ID and consistent categorization, modeling profit is difficult. I am reviewing the dataset now to fix the missing IDs and the ‘Chair’ category overlap. I will upload the corrected version shortly. Thanks for helping me improve this resource!
Meanwhile, if you need data immediately, you can use our sample data generators to create a custom dataset with the specific fields you need: https://excelx.com/practice-data/generators/
Do you have any raw data of sales customer and inventory
Hi! Yes, for that specific combination, I recommend checking our Sales Data Builder: https://excelx.com/practice-data/generators/sales/
Additionally, if you want to build a completely custom dataset with any specific fields you require, please check our Bulk Data Generator: https://excelx.com/practice-data/generators/bulk-data/
Thank you very much. It will help for sure.
You are very welcome! I am glad to hear these datasets will be helpful for you. Happy analyzing!
Regards-PNRao!
i want retail store dashboard
Glad you asked! We are currently working on a new Dashboard Series that will include a Retail Store template. It will be available on the site in about two weeks. Thanks for your patience!
Very thank you it so helped me
Your download option very strait thank you so much 💕💕💕💕💕💕💕💕💕💕💕💕
You’re very welcome! We are glad you found our Free Sales Datasets helpful for your work.