Welcome to your very first lesson! Excel is one of the most in-demand skills in the world, not just for office jobs, but for personal life. Why? Because it helps you take raw data (like numbers and lists) and turn it into clear decisions.
This first lesson will get you comfortable with the screen. By the end, you’ll know what you’re looking at, where the main tools are, and you’ll have performed your first calculation!
What is Excel, Really?
At its heart, Excel is a powerful spreadsheet program. The easiest way to think of it is as a limitless sheet of smart grid paper.
You use it to:
- Store Data: Anything from a simple contact list to a workout log.
- Organize Data: Instantly sort a list of products by price, or filter a list of tasks by due date.
- Calculate & Analyze: This is its superpower. Answer questions like, “What’s my total spending this month?” or “What’s the average grade on the test?”
- Visualize Data: Turn rows of boring numbers into insightful charts and graphs that you can understand at a glance.
The 3 Building Blocks of Excel: Rows, Columns, and Cells
When you open a worksheet, the entire screen is covered by a giant grid. This grid is your main workspace. It might look simple, but it’s an incredibly powerful system for organizing data.
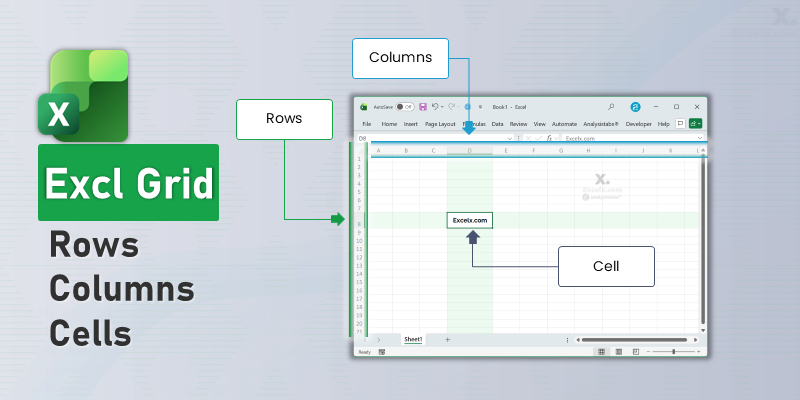
It’s made of three simple parts that work together:
- Columns: These are all the vertical (up and down) sections. They are labeled with letters at the top (
A,B,C…). When you get pastZ, it continues withAA,AB, and so on, all the way toXFD! - Rows: These are all the horizontal (left to right) sections. They are labeled with numbers on the left side (
1,2,3…). A single worksheet can have over a million rows. - Cells: This is the most important part. A cell is a single box where a Column and a Row intersect. It’s the fundamental container where you type your data—a piece of text, a number, or a formula.
Every cell on the grid has a unique “name,” or address, which is like its GPS coordinate. You find this address by combining its column letter and its row number.
For example, the cell at the intersection of column C and row 5 is named C5. This address system is the core concept that makes Excel work. When you write a formula, you’ll use these addresses to tell Excel which cells to use in its calculation (e.g., “add the number in C5 to the number in C6“).
Workbook vs. Worksheet: Understanding the Basics
This is a mental model you should learn right away:
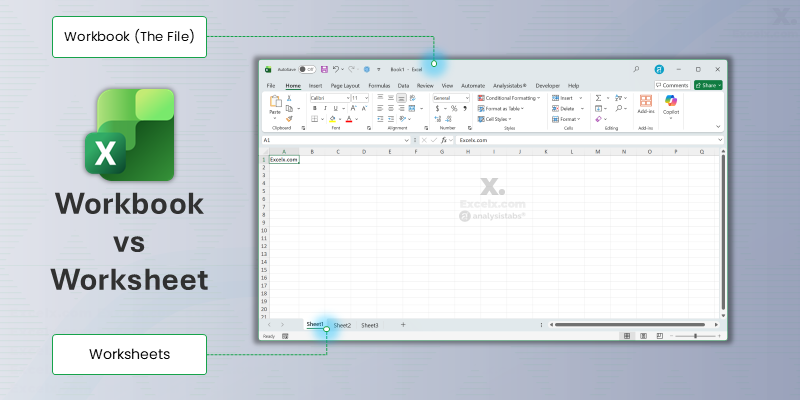
- An entire Excel file is called a Workbook. Think of this as your 3-ring binder.
- Inside your Workbook, you have one or more Worksheets (or “sheets”). Think of these as the individual pages or dividers in your binder.
You might have a Workbook called “2025 Budget,” and inside it, you’d have worksheets for “January,” “February,” “March,” and so on.
A Beginner’s Tour of the Excel Interface
When you first open Excel, it can look intimidating. Let’s break down the main areas so you know what they do.
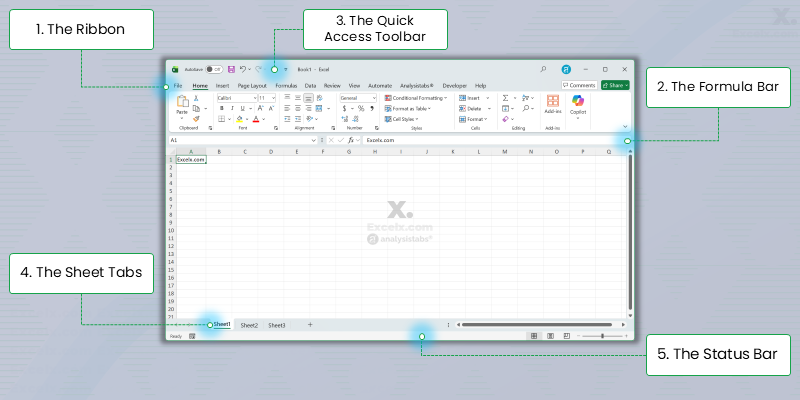
1. The Ribbon (Your Toolkit)
This is your primary command center. It’s the big bar at the top, organized into Tabs (like Home, Insert, Data). When you click a tab, the Ribbon changes to show all the tools for that category.
These tools are further organized into Groups. For example, on the Home tab, you’ll find a “Font” group for making text bold or changing its color, and an “Alignment” group for centering your text. You don’t need to memorize them—just know this is where you’ll go to find a button to do something.
- Home: Your most-used tools are here: font formatting (bold, color, size), alignment, and copy/paste. This tab controls the “look” of your data.
- Insert: Use this to add things into your sheet, like charts, tables, icons, and pictures.
- Formulas: Your complete library for all of Excel’s built-in functions (like
SUMorAVERAGE). - Data: Contains powerful tools for sorting, filtering, and managing large lists of data.
2. The Formula Bar (The “Truth” Bar)
This is one of the most important parts of Excel, located just above the grid. It’s composed of two parts: the Name Box on the left and the Formula Bar on the right.
- Name Box: This little box shows the “address” of the cell you currently have selected (e.g.,
B4). - Formula Bar: This bar shows you the true content of that selected cell.
Why “truth”? A cell might display the number 150, but the formula bar will show you the formula behind it, like =100+50. You will always use this bar to write and edit your formulas. If you try to type a long formula directly into a small cell, it’s difficult. This bar gives you all the space you need.
3. The Quick Access Toolbar
This is the small row of icons at the very top-left of your window, above the Ribbon. By default, it has Save, Undo, and Redo.
Its main power is that you can customize it by adding a shortcut to any button you use frequently. For example, if you use “Sort A-Z” all the time, you can add it here to avoid clicking to the “Data” tab first. It’s a real time-saver.
4. The Sheet Tabs (Your Binder’s Pages)
At the bottom-left, you’ll see your worksheets (e.g., Sheet1). These are the tabs that let you flip between the “pages” of your workbook (remember our binder analogy?).
You can easily manage these tabs:
- Click the
+icon to add a new, blank sheet to your workbook. - Double-click a tab’s name to rename it (e.g., from “Sheet1” to “January Budget”).
- Right-click a tab to see more options, like changing its color, deleting it, or making a copy.
5. The Status Bar (Your Quick Helper)
Don’t ignore this thin bar at the very bottom of the window! It’s surprisingly helpful and has two main jobs.
- Quick Calculations: If you click and drag to select a few cells with numbers, the Status Bar will instantly show you their Sum, Count (how many cells you selected), and Average—no formula needed! It’s a “no-formula dashboard.”
- View & Zoom Controls: On the far right, you’ll find the Zoom Slider to zoom in and out, as well as buttons to change your page layout (e.g., “Page Break Preview”).
Entering Data: Understanding Text vs. Formulas
This is the most exciting part and the “Aha!” moment for most new users. This is where you see how Excel is different from a simple notepad or calculator. You’ll learn the difference between “static data” (like text) and a “dynamic formula” that does work for you.
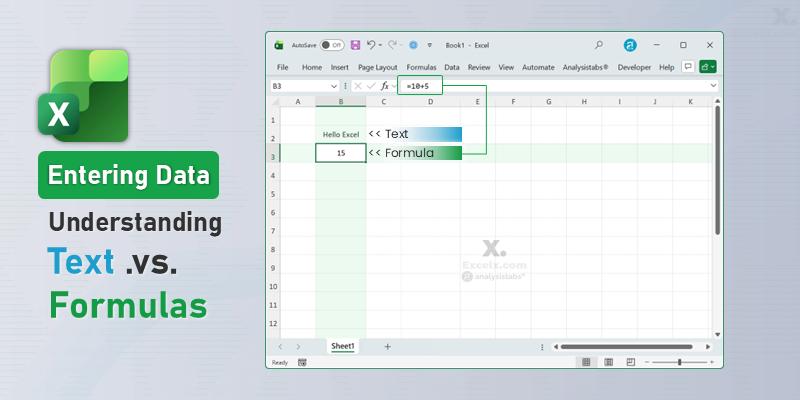
Let’s put this all together in a 30-second task.
- Click on cell
B2. - Type
Hello Exceland press Enter. - Now, click on cell
B3. - Type this exactly:
=10+5and press Enter.
Now, let’s see what happened.
- Click on
B2. The cell displays “Hello Excel” and the Formula Bar (the “truth” bar) shows “Hello Excel”. This is just data. - Now, click on
B3. The cell displays15, but look at the Formula Bar! It shows you the “truth”: the formula=10+5.
You’ve just learned the most important concept in Excel: the difference between static data and a dynamic formula. You’ve already used the grid, the cells, and the formula bar!
What You Learned in This Lesson
You covered a lot of ground! Here are the key concepts you’ve learned:
- What Excel is for: It’s a powerful tool for storing, organizing, analyzing, and visualizing data.
- The 3 Building Blocks: The grid is made of Columns (A, B, C), Rows (1, 2, 3), and Cells.
- Cell Addresses: A cell’s unique name (like
C5) is its “address,” which is essential for formulas. - Workbook vs. Worksheet: The Workbook is the entire file (the binder), and Worksheets are the individual tabs (the pages).
- The Interface Tour: You can now identify the Ribbon (toolkit), the Formula Bar (“truth” bar), and the Status Bar (quick helper).
- Data vs. Formulas: You learned the most important concept—that a cell can hold simple data (like “Hello”) or a dynamic formula (like
=10+5) that produces a result.
Lesson 1 Complete!
Congratulations! You now know what Excel is for, how it’s structured (Workbooks and Sheets), and where its main controls are. You even wrote your first formula.
In the next lesson, we’ll use this knowledge to create, open, and save your very first “real” workbook.
