
Ever wondered what Microsoft Excel is actually for? You’ve probably seen the iconic green logo or the grid of cells, but Excel is much more than just a digital spreadsheet. It’s one of the most powerful and essential software tools included in the Microsoft 365 suite, used by professionals in every industry across the globe.
In simple terms, Microsoft Excel is a spreadsheet application developed by Microsoft that allows you to store, organize, calculate, analyze, and visualize data using a grid of rows and columns. From managing a simple grocery list to creating multi-million-dollar financial models used on Wall Street, Excel provides the tools to turn raw data into meaningful insights.
With an estimated 1.1 to 1.5 billion users worldwide, Excel is arguably the most widely used business software on the planet. Whether you are a student tracking grades, an accountant preparing tax returns, a scientist modeling experimental data, or a project manager scheduling milestones — Excel provides the tools to get the job done efficiently.
This complete guide will walk you through everything you need to know about Microsoft Excel in 2026 — from the definition and basic components to its powerful features, real-world applications, the latest AI-powered Copilot capabilities, and how it compares to Google Sheets.
Key Takeaways
- What is it? Excel is a spreadsheet application for organizing, calculating, and analyzing data in rows and columns. It is part of the Microsoft 365 (formerly Office 365) productivity suite.
- Who uses it? Everyone — from students and teachers to financial analysts, scientists, project managers, and Fortune 500 executives.
- What can it do? Perform calculations with 500+ built-in functions, create charts and graphs, build PivotTables, manage budgets, track projects, automate tasks with macros, and now leverage AI through Copilot.
- Why is it important? Excel proficiency is a top-requested skill in job postings across nearly every industry and is essential for data-driven decision-making.
What is Microsoft Excel? (Definition and Meaning)
Microsoft Excel is a spreadsheet program developed by Microsoft Corporation. It is part of the Microsoft 365 (formerly Office 365) productivity suite and is available on Windows, macOS, the web, and mobile devices (iOS and Android).
At its core, Excel provides a digital workspace where each intersection of a row and a column forms a “cell.” Each cell can hold text, numbers, dates, or formulas. This deceptively simple structure is what makes Excel so powerful — it can scale from a personal to-do list to an enterprise-grade data analysis platform.
In technical terms, Excel is classified as a spreadsheet application software — a type of productivity software designed for organizing, computing, and presenting tabular data. It belongs to the broader category of office suite applications alongside Microsoft Word, PowerPoint, and Outlook.
Related Guide: Complete List of Excel Features in 2026
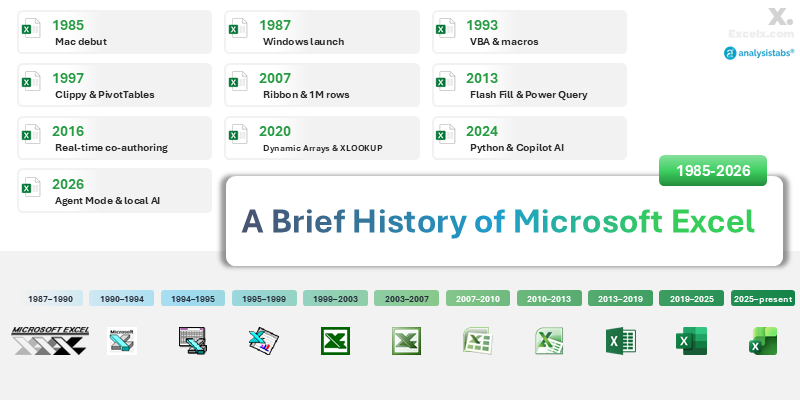
A Brief History of Microsoft Excel
Understanding where Excel came from helps explain why it dominates the spreadsheet market today. Excel was not the first spreadsheet — VisiCalc (1979) and Lotus 1-2-3 (1983) came before it. Excel eventually overtook Lotus 1-2-3 largely because of its early bet on the Windows platform and its superior graphical interface.
Here are the most important milestones:
- 1985: Excel 1.0 launches exclusively for Macintosh, beating Lotus 1-2-3 to the Mac market.
- 1987: Excel 2.0 for Windows arrives, gaining traction as Windows grew in popularity.
- 1993: Excel 5.0 introduces VBA (Visual Basic for Applications), enabling macros and automation.
- 1997: Excel 97 adds the Office Assistant (“Clippy”), improved PivotTables, and data validation.
- 2007: Excel 2007 introduces the Ribbon interface, the .xlsx file format, and expands the grid to over 1 million rows.
- 2013: Excel 2013 introduces Flash Fill, recommended charts, and Power Query as an add-in.
- 2016: Real-time co-authoring, Power Query built-in, and 6 new chart types arrive.
- 2020: Dynamic Arrays revolutionize formulas — XLOOKUP, UNIQUE, SORT, FILTER, LET, and LAMBDA functions are introduced.
- 2024: Python in Excel, Copilot AI integration, and GROUPBY / PIVOTBY functions launch.
- 2026: Agent Mode for Copilot, local file Copilot support, and a unified AI experience roll out.
Related Guide: Complete History of Excel: Every Version from 1985 to 2026 [/history/]
The Key Components of Excel: A Quick Tour
When you open Excel, you’ll see a grid of cells. Understanding these core components is the first step to becoming proficient.
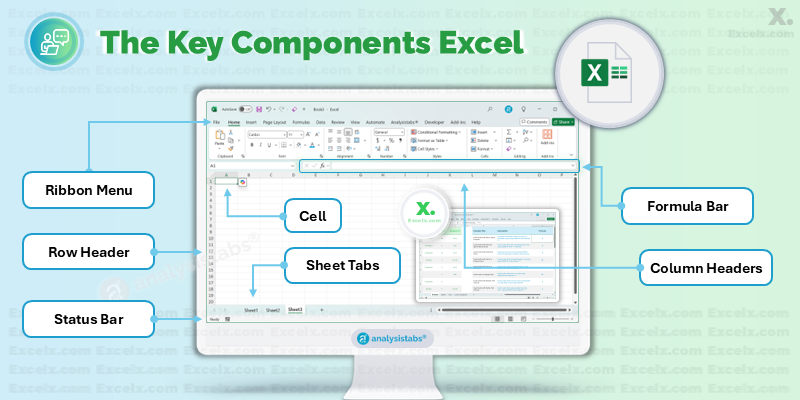
- Ribbon: The toolbar at the top of the window, organized into tabs (Home, Insert, Page Layout, Formulas, Data, Review, View). Each tab contains groups of related commands. The Ribbon replaced the old menu system starting in Excel 2007.
- Workbook: The entire Excel file you are working in (e.g.,
Budget_2026.xlsx). A single workbook can contain multiple worksheets. - Worksheet (or Sheet): A single “page” or “tab” within a workbook. Each worksheet has its own grid of cells. You can add, rename, move, copy, or delete sheets using the sheet tabs at the bottom.
- Cell: The basic unit of a spreadsheet — the box where a row and column intersect. Each cell has a unique address like
A1,B5, orZ100. A cell can contain text, numbers, dates, or formulas. - Row: A horizontal line of cells, numbered 1 through 1,048,576.
- Column: A vertical line of cells, lettered A through XFD (16,384 columns total).
- Range: A group of selected cells, referenced by the top-left and bottom-right corners (e.g.,
A1:D10). - Formula Bar: Located above the grid, it shows the contents (value or formula) of the currently selected cell. You can edit cell content directly here.
- Name Box: Located to the left of the Formula Bar, it displays the address of the selected cell (e.g.,
A1). You can also type a cell address or named range here to navigate quickly. - Status Bar: The bar at the very bottom of the window. It shows information like the SUM, AVERAGE, and COUNT of selected cells, zoom level, and current view mode.
Related Guides: Workbook vs. Worksheet: What’s the Difference? [/workbook-vs-worksheet/] | What is a Spreadsheet? [/spreadsheet/]
Core Features and Capabilities of Excel
Excel is far more than a simple grid. Its rich feature set is what separates it from basic spreadsheet tools. Let’s explore each major capability.
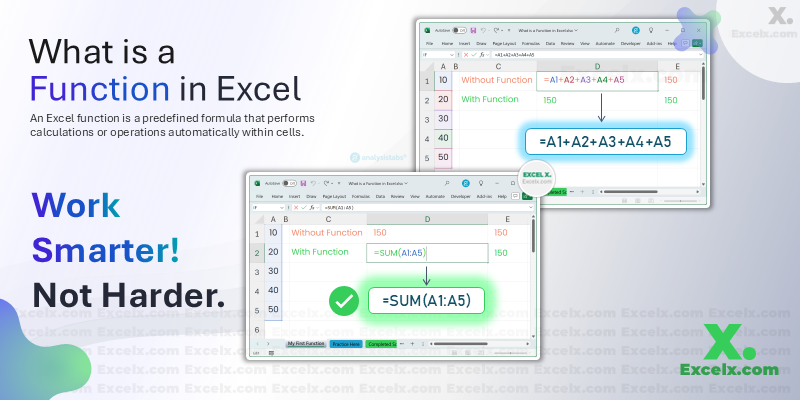
Formulas and Functions
Formulas are the heart of Excel. A formula is an expression that calculates the value of a cell. Every formula begins with an equals sign (=). Functions are pre-built formulas that perform specific calculations.
Excel has 500+ built-in functions organized into categories:
- Mathematical: SUM, SUMIF, SUMIFS, ROUND, ABS, MOD
- Statistical: AVERAGE, AVERAGEIF, COUNT, COUNTIF, MAX, MIN, MEDIAN
- Logical: IF, AND, OR, NOT, IFS, SWITCH, IFERROR
- Lookup & Reference: VLOOKUP, HLOOKUP, XLOOKUP, INDEX, MATCH
- Text: LEFT, RIGHT, MID, LEN, TRIM, UPPER, LOWER, TEXTJOIN
- Date & Time: TODAY, NOW, DATE, YEAR, MONTH, DAY, NETWORKDAYS
- Financial: PMT, FV, PV, NPV, IRR, XNPV
- Dynamic Arrays (Modern): UNIQUE, SORT, SORTBY, FILTER, SEQUENCE, RANDARRAY, GROUPBY, PIVOTBY
Related Guides: What are Excel Formulas? | Excel Functions List: 500+ Functions by Category
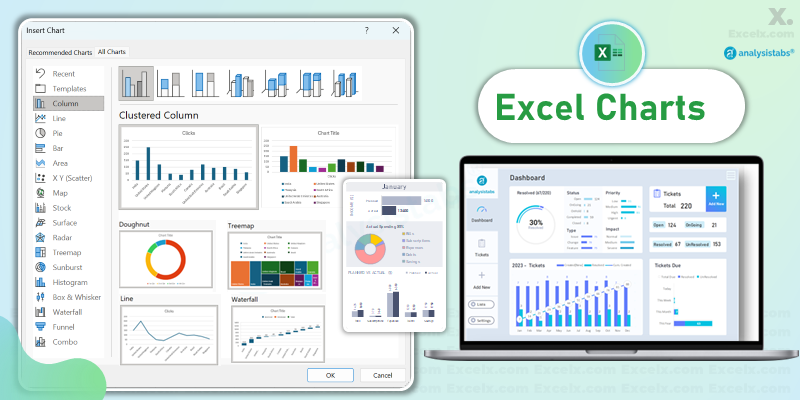
Charts and Data Visualization
Raw numbers can be hard to interpret. Excel’s charting engine transforms your data into professional, publication-ready visuals. Excel supports over 20 chart types including column/bar charts, line charts, pie/doughnut charts, scatter plots, waterfall charts, funnel charts, map charts, treemap/sunburst charts, and sparklines (tiny charts inside a single cell).
Conditional Formatting is another powerful visualization tool that lets you apply color scales, data bars, icon sets, and custom rules to highlight cells based on their values — turning your spreadsheet into a visual dashboard without creating a single chart.
Related Guide: Excel Charts: Every Type Explained with Examples [/charts/] | Conditional Formatting in Excel: Complete Guide [/conditional-formatting/]
PivotTables and PivotCharts
PivotTables are one of Excel’s most powerful features. They let you summarize, analyze, explore, and present large datasets in seconds — without writing a single formula. You simply drag fields into four areas (Rows, Columns, Values, and Filters) and Excel instantly aggregates your data.
PivotCharts are charts linked to PivotTables that update automatically when you change the layout. You can also add Slicers — interactive filter buttons — that let anyone filter the data with a single click.
Related Guide: What is a PivotTable? Complete Beginner’s Guide [/pivottable/]
Data Management Tools
Excel includes a suite of tools for cleaning, transforming, and managing data:
- Sort & Filter: Quickly organize data alphabetically, numerically, or by color. Use AutoFilter dropdowns to show only matching rows.
- Data Validation: Restrict what users can enter in a cell — allow only numbers, dates, or create dropdown lists of valid options.
- Remove Duplicates: One-click removal of duplicate rows based on selected columns.
- Text to Columns: Split a single column (like full names) into multiple columns (first name, last name).
- Flash Fill: Excel detects patterns in your data and fills in the rest automatically.
- Tables (Ctrl+T): Convert a range to an Excel Table for automatic formatting, structured references, and auto-expanding ranges.
Related Guides: Data Validation in Excel [/data-validation/] | Excel Tables: Why and How to Use Them [/tables/]
Power Query (Get & Transform Data)
Power Query is Excel’s built-in ETL (Extract, Transform, Load) tool. It lets you connect to dozens of data sources — CSV files, databases, web pages, APIs, SharePoint, and more — and then clean and reshape that data using a visual, code-free interface. Common tasks include merging data from multiple files, removing errors, unpivoting data, and refreshing with one click when source data changes.
Related Guide: Power Query in Excel: Beginner’s Guide [/power-query/]
Macros and VBA
Macros let you record a sequence of actions and replay them with a single click or keyboard shortcut. For more advanced automation, you can write VBA (Visual Basic for Applications) code in Excel’s built-in code editor. VBA can generate reports automatically, send emails via Outlook, create custom functions, build UserForms for data entry, and interact with other Office applications.
Pro Tip: If you’re new to automation, start with the Macro Recorder (View > Macros > Record Macro). It generates VBA code from your actions, which you can then study and modify.
Related Guide: Excel Macros: Complete Guide
Collaboration and Sharing
Modern Excel (via Microsoft 365) supports real-time co-authoring. Multiple people can edit the same workbook simultaneously when the file is stored in OneDrive or SharePoint. You can see other users’ cursors and changes in real time, leave comments and @mention collaborators, and use version history to restore previous versions.
Python in Excel
One of the most exciting recent additions is the ability to run Python code directly inside Excel cells using the =PY() function. Python runs securely in the Microsoft Cloud and integrates with popular libraries like pandas, matplotlib, seaborn, and scikit-learn — bridging the gap between spreadsheet users and data science workflows.
Related Guide: Python in Excel: What It Is and How to Use It [/python-in-excel/]
What is Excel Used For? (Real-World Applications)
While Excel can be used for almost anything involving numbers and lists, its power shines in specific professional domains. Here are the most common real-world applications:
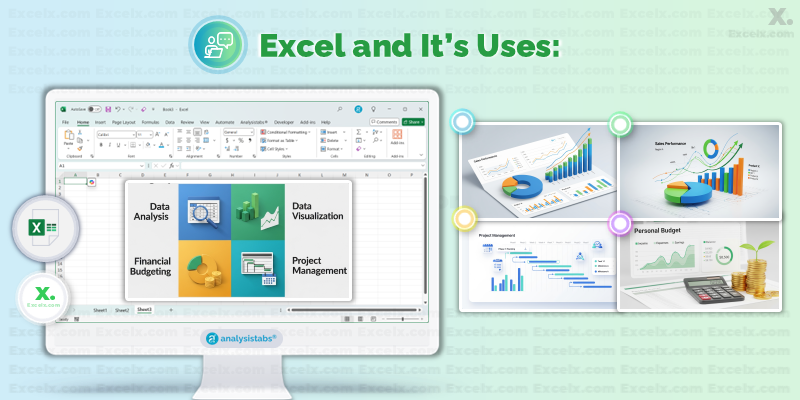
1. Finance and Accounting
Excel is the go-to tool for financial professionals. Common tasks include building budgets, forecasts, and financial models; preparing profit & loss statements and balance sheets; performing loan amortization, NPV/IRR analysis, and sensitivity analysis; reconciling bank statements; and creating interactive financial dashboards with PivotTables and charts.
2. Data Analysis and Business Intelligence
This is Excel’s core strength. You can take thousands of rows of raw data and quickly make sense of it through sorting and filtering, PivotTables, Power Query, and now AI-powered Copilot analysis. Analysts use Excel for sales trends, customer behavior analysis, KPI dashboards, and statistical analysis.
3. Project Management
Project managers rely on Excel to build Gantt charts and project timelines, track tasks and milestones, manage resource allocation, create risk registers, and monitor project budgets and variance analysis.
Related: Free Project Management Templates
4. Human Resources
HR professionals use Excel for managing employee databases, tracking attendance and leave balances, analyzing recruitment pipelines, and creating payroll calculators and tax worksheets.
5. Marketing and Sales
Marketing teams track campaign performance and ROI, analyze conversion rates and A/B test results, manage customer lists and CRM data, build sales forecasting models, and create competitive analysis matrices.
6. Science and Engineering
Scientists and engineers use Excel for recording and analyzing experimental data, creating statistical models and visualizations, running simulations with What-If Analysis tools (Goal Seek, Scenario Manager, Data Tables), and managing equipment inventory.
7. Education and Personal Use
Students and individuals use Excel for managing grade books, creating personal budgets and expense trackers, planning events and travel itineraries, and tracking fitness goals and health metrics.
Related Guide: What is Excel Used For? Complete Guide with Examples | Advantages and Disadvantages of Excel [/advantages-disadvantages/]
Excel File Formats Explained
Excel supports several file formats, each designed for different purposes:
- .xlsx (Excel Workbook) — The default format for modern Excel files. Does NOT support macros. Best for everyday use.
- .xlsm (Macro-Enabled Workbook) — Same as .xlsx but supports VBA macros. Use when your file contains automation code.
- .xlsb (Excel Binary Workbook) — A binary format that is faster to save/open for very large files. Supports macros.
- .xls (Excel 97–2003 Workbook) — The legacy format. Limited to 65,536 rows and 256 columns. Avoid for new files.
- .csv (Comma-Separated Values) — A plain text format with no formatting, charts, or formulas — just data. Universal compatibility.
- .xltx / .xltm (Excel Template) — Template files that create a new workbook when opened, great for standardized reports.
Related Guide: Excel File Formats Explained: .xlsx, .xlsm, .csv and More [/file-formats/]
Excel vs. Google Sheets: How Do They Compare?
Google Sheets is Excel’s biggest competitor. Both are excellent tools, but they serve different strengths:
- Price: Excel for the web and mobile is free; the desktop app requires a Microsoft 365 subscription (~$6.99–$12.99/mo). Google Sheets is completely free.
- Row Limit: Excel supports over 1 million rows; Google Sheets is limited to about 10 million cells.
- Formulas: Excel has 500+ functions including DAX, LAMBDA, and Dynamic Arrays. Google Sheets has 400+ with some unique ones like GOOGLEFINANCE.
- Automation: Excel uses VBA (extremely powerful). Google Sheets uses Google Apps Script (JavaScript-based).
- AI: Excel has Microsoft Copilot with Agent Mode. Google Sheets has growing Gemini AI integration.
- PivotTables: Excel has full-featured PivotTables with Slicers, Timelines, and Power Pivot. Google Sheets has basic PivotTables.
- Collaboration: Both support real-time co-authoring, but Google Sheets’ collaboration experience is more seamless natively.
- Best For: Excel excels at power use, financial modeling, enterprise needs, and large datasets. Google Sheets is ideal for casual users, quick collaboration, startups, and education.
The bottom line: Choose Excel for power and advanced analytics. Choose Google Sheets for simplicity and free real-time collaboration. Many professionals use both.
Related Guide: Excel vs. Google Sheets: The Complete 2026 Comparison [/excel-vs-google-sheets/]
What’s New in Excel in 2026 (AI & Copilot)
2025 and 2026 have been transformative years for Excel. Microsoft has aggressively integrated AI capabilities through Copilot, making Excel smarter and more accessible than ever.
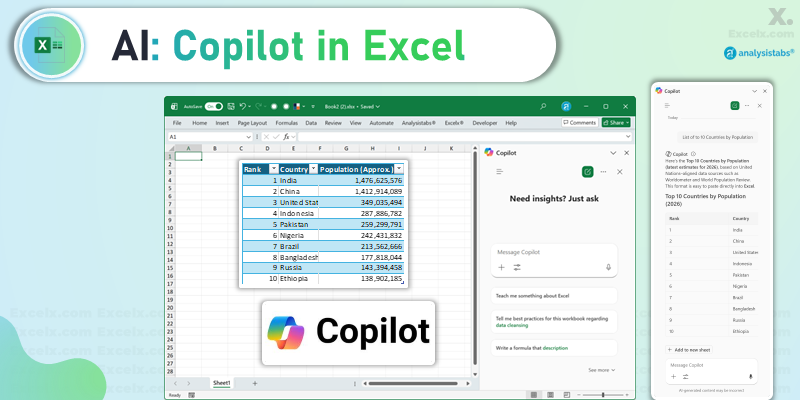
Copilot in Excel
Microsoft Copilot is an AI assistant built directly into Excel. It can analyze your data and surface insights in natural language, generate complex formulas from plain English descriptions, create charts and PivotTables from a single prompt, identify trends, outliers, and patterns, and answer questions about your spreadsheet like a data analyst.
Agent Mode (New in 2026)
Agent Mode takes Copilot further. Instead of just answering questions, it actively edits and refines your workbook. You describe what you want (e.g., “Build an expense tracking template with variance formulas”), and Agent Mode builds it step by step, reasoning through each change transparently. It rolled out on Desktop, Mac, and Web in early 2026.
Local File Support for Copilot
Previously, Copilot required files stored in the cloud. As of early 2026, Copilot now works with locally stored .xlsx, .xlsb, .xlsm, and .ods files on both Windows and Mac — a game-changer for users who work offline.
Python in Excel (Generally Available)
Python in Excel moved to general availability, allowing you to use Python’s data science ecosystem (pandas, matplotlib, seaborn, scikit-learn) directly inside Excel cells using the =PY() function.
Related Guide: Copilot in Excel: What It Can Do in 2026 [/copilot/] | Python in Excel Guide [/python-in-excel/]
How to Get Excel (Pricing & Platforms)
There are several ways to access Excel, ranging from completely free to enterprise subscriptions:
- Excel for the Web (Free): Use Excel in any browser at office.com. Requires a free Microsoft account. Covers most basic features.
- Excel Mobile App (Free): Available on iOS and Android for viewing, editing, and creating workbooks on the go.
- Microsoft 365 Personal (~$6.99/mo): Full desktop Excel + Word, PowerPoint, Outlook, and 1TB OneDrive for 1 user.
- Microsoft 365 Family (~$9.99/mo): Same as Personal but for up to 6 users, each with 1TB OneDrive.
- Microsoft 365 Business ($6–$22/mo per user): Includes desktop apps + business email, Teams, SharePoint, and admin tools.
- Office LTSC 2024 (~$249 one-time): Perpetual license with no subscription. No cloud features or Copilot.
Related Guide: How to Get Excel: Pricing, Plans & Free Options [/pricing/]
Why You Should Learn Excel Today
Whether you are a student, a job seeker, or a seasoned professional, mastering Excel is an essential skill that can significantly boost your productivity and career prospects. Here’s why:
- Career Advantage: Excel is listed as a required or preferred skill in millions of job postings across finance, marketing, operations, HR, consulting, and engineering.
- Universal Applicability: Unlike specialized tools, Excel is used in virtually every department of every organization. It is the common language of business data.
- Low Barrier to Entry: You can start using Excel productively in minutes, yet spend a career mastering its advanced features.
- Data Literacy: Learning Excel builds foundational data literacy skills — how to organize, analyze, and communicate with data — that transfer to any tool.
- Automation Saves Time: Even basic formula knowledge can save hours of manual work every week. PivotTables and Power Query can save days.
- AI Amplifies Your Skills: With Copilot, your Excel skills are multiplied. Knowing what Excel can do helps you ask better questions and validate AI-generated results.
Related Guide: Excel Basics for Beginners: Start Learning [/basics/]
Frequently Asked Questions (FAQ)
Is Microsoft Excel free?
Yes and no. Excel for the Web (at office.com) and the Excel mobile apps are completely free with a Microsoft account. However, the full desktop application requires a Microsoft 365 subscription or a one-time purchase of Office LTSC 2024.
What is the difference between Excel and a spreadsheet?
A “spreadsheet” is a generic term for any application that organizes data in rows and columns. Excel is a specific spreadsheet application made by Microsoft. Other spreadsheet apps include Google Sheets, Apple Numbers, and LibreOffice Calc.
What is the maximum number of rows in Excel?
Modern Excel (.xlsx format) supports up to 1,048,576 rows and 16,384 columns per worksheet. If you need more, consider using Power Pivot’s Data Model or a database.
Can I use Excel on a Mac?
Yes. Excel is available for macOS as part of Microsoft 365. It has near-feature-parity with the Windows version. You can also use Excel for the Web on any Mac browser for free.
What are Dynamic Arrays?
Dynamic Arrays (introduced in 2020) allow a single formula to return multiple results that automatically “spill” into adjacent cells. Functions like UNIQUE, SORT, FILTER, SEQUENCE, and XLOOKUP leverage this feature.
Is VBA still relevant in 2026?
Yes, VBA remains widely used, especially in finance, accounting, and enterprise environments. However, newer alternatives like Power Automate, Office Scripts (JavaScript), and Python in Excel are growing in popularity.
What is the difference between VLOOKUP and XLOOKUP?
XLOOKUP is the modern replacement for VLOOKUP. It is simpler (no column index number needed), more flexible (searches in any direction), supports exact/approximate/wildcard matches, and handles errors gracefully with a built-in “if not found” parameter.
Do I need the internet to use Excel?
The desktop version works fully offline. Excel for the Web requires an internet connection. The mobile apps can work offline with limited functionality if the file is synced to the device.
Conclusion
Microsoft Excel is far more than a grid of cells. It is a complete data analysis platform that scales from simple to-do lists to enterprise-grade financial models. With the addition of AI-powered Copilot, Python integration, and dynamic arrays, Excel in 2026 is more powerful and accessible than it has ever been.
Whether you are a complete beginner or a seasoned analyst, there is always more to discover. The best way to learn Excel is by doing — start with a real problem, build a real spreadsheet, and explore the features as you need them.
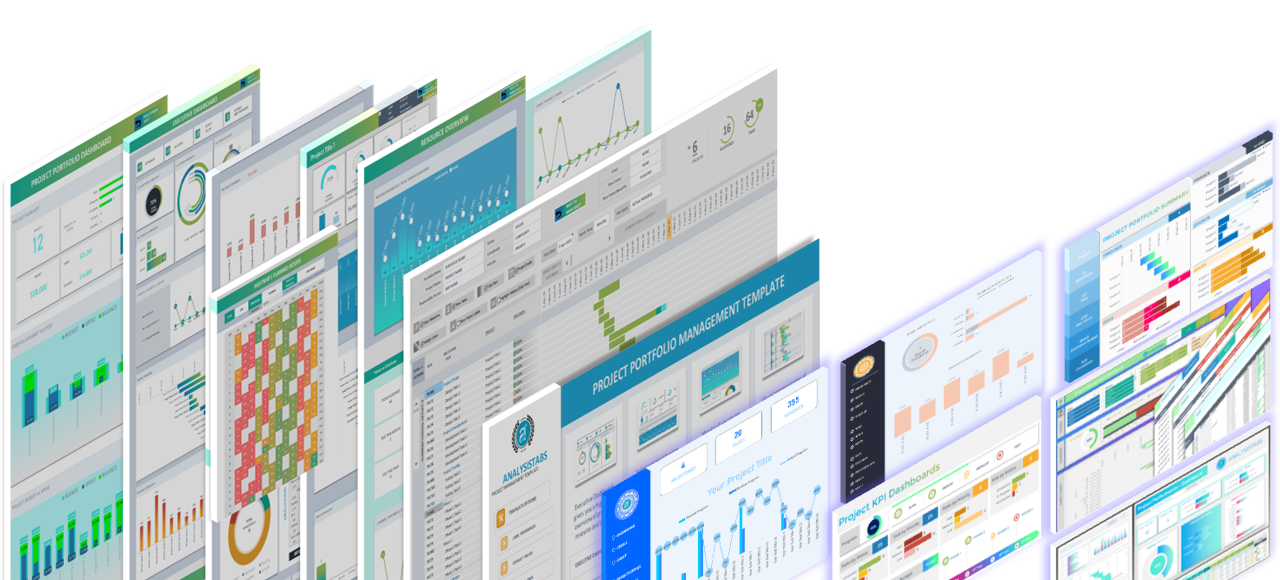
Ready to get started? Explore our library of Free Excel Templates to see practical examples in action, dive into our Top Excel Formulas for Beginners, or practice with real-world data at our Practice Data Hub.
so helpful
Thank you!
love it
Please how do I learn how to use Excel
Hi! It can feel overwhelming at first, but you only need a few basics to get started. I suggest learning in this order:
Data Entry (Typing in cells and formatting them).
Basic Math (Addition, Subtraction, Multiplication).
The SUM Function (Adding up a list of numbers).
Once you master those, you can move on to fun stuff like IF formulas and Charts. Good luck!
You can follow our Tutorials in the Menu or refer to our Learning & Practice Hubs:
Start Here: https://excelx.com/learn/
Practice Data: https://excelx.com/practice-data/
Formulas: https://excelx.com/formulas-functions/
Shortcuts: https://excelx.com/shortcuts/
Macros: https://excelx.com/macros/
Templates: https://excelx.com/templates/
Hope this helps!
Thanks
PNRao