
- ⬇ Free Download
- All 11 Templates
- 🔧 Customize
- 🧮 Formulas
- 🕒 Hourly & Daily
- 🗓️ Weekly
- ✅ Basic
- 📊 Monthly
- 📄 Word, PPT & Sheets
- ❓ FAQ
- 💬 Comments
Managing project timelines shouldn’t be a struggle. This page collects 11 free Gantt chart Excel templates — 8 spreadsheet layouts covering hourly, daily, weekly, monthly, annual and multi-year views, plus Word, PowerPoint and Google Sheets versions. Every Excel file builds its timeline automatically from conditional formatting, so you enter a start date and duration and the bars appear. No macros, no add-ins, no subscription.
Free Simple Gantt Chart Excel Template: Download Now
This is our most popular Gantt chart Excel template out of the 11 free layouts on this page. Download this one to get started instantly, or browse the full set below.
- Automated Timeline: Enter your start date and duration, and the bars update instantly using built-in Excel logic.
- Progress Tracking: Update the “% Complete” column to see visual progress bars directly on your chart.
- Milestone Markers: Highlight critical deadlines to ensure your team stays on schedule.
- Weekend Handling: Duration formulas can count calendar days or working days only, using NETWORKDAYS.
11 Free Gantt Chart Templates for Excel
Each Excel template uses automated conditional formatting — enter your dates and the Gantt bars appear instantly. Pick the timeline view that matches your project.
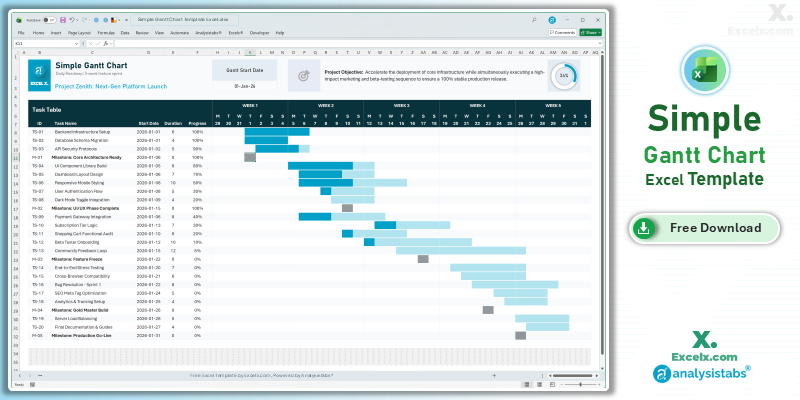
1. Simple Gantt Chart ⭐
The go-to Gantt chart for most projects. Automated timeline bars, progress tracking, and milestone markers across a rolling week-by-week calendar.
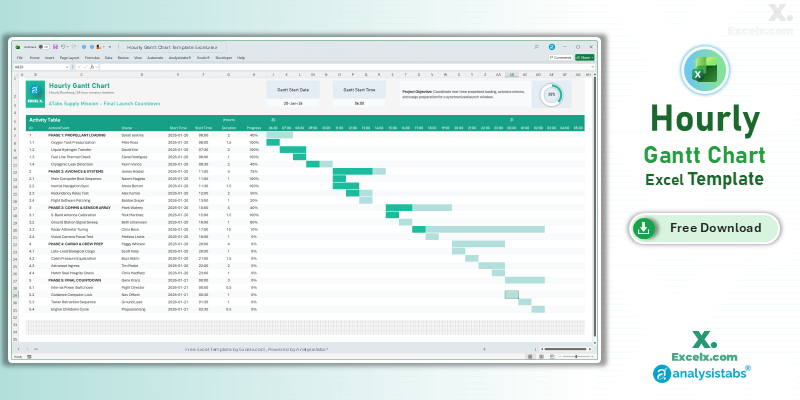
2. Hourly Gantt Chart
Manage tasks by the hour. Ideal for event management, production schedules, or shift planning.
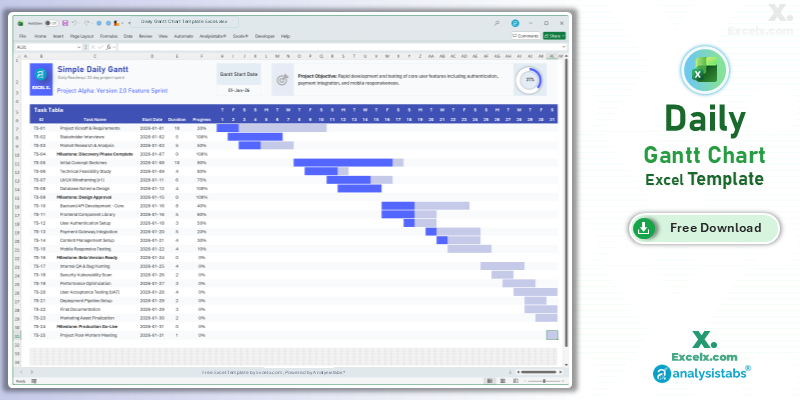
3. Daily Gantt Chart
Day-by-day task breakdown with weekend handling. Perfect for short-term project phases.
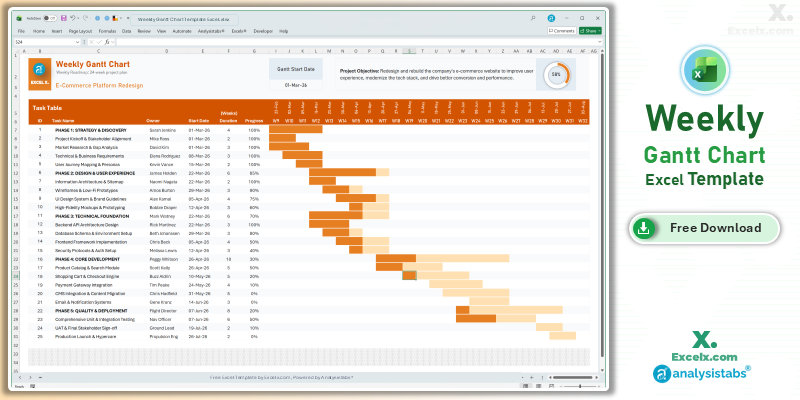
4. Weekly Gantt Chart
Optimized for 4–12 week agile sprints. Dynamic week headings update automatically.
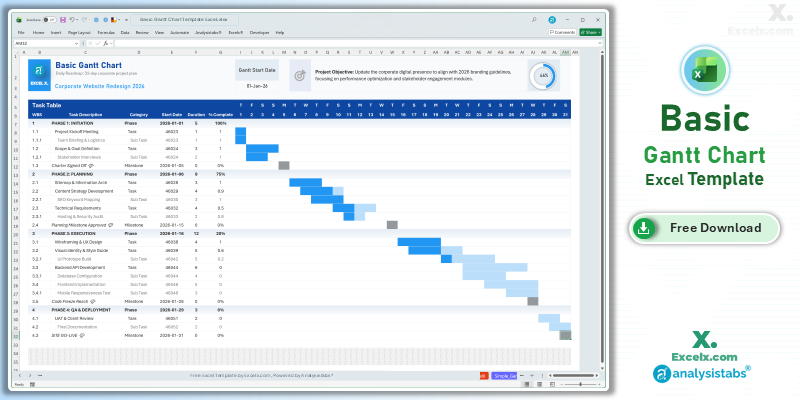
5. Basic Gantt Chart (with WBS & Subtasks)
Work Breakdown Structure numbering (1, 1.1, 1.1.1) with Phase, Task, Sub-Task and Milestone rows. Best when your plan has nested subtasks.
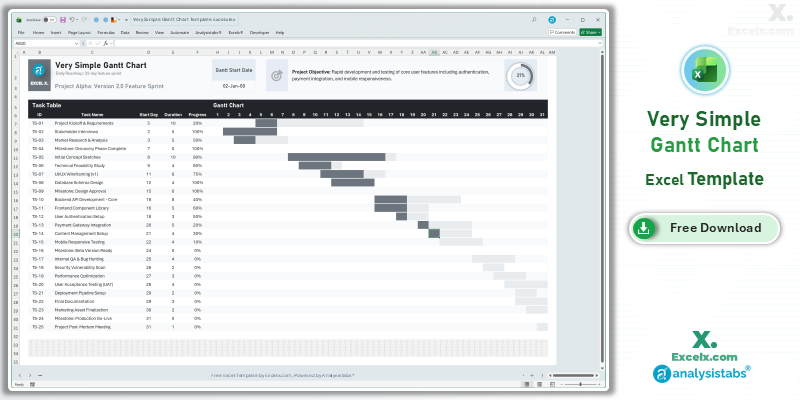
6. Very Simple Gantt Chart (No Dates)
Uses day numbers (Day 1, Day 2 …) instead of calendar dates across a 31-day grid. The easiest starting point if you don’t have fixed dates yet.
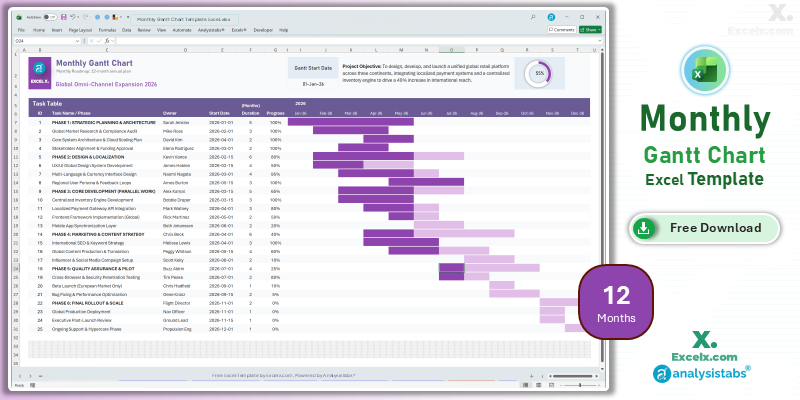
7. 12-Month Annual Gantt
Visualize your entire yearly plan on one screen. Track quarterly goals and resource overlap.
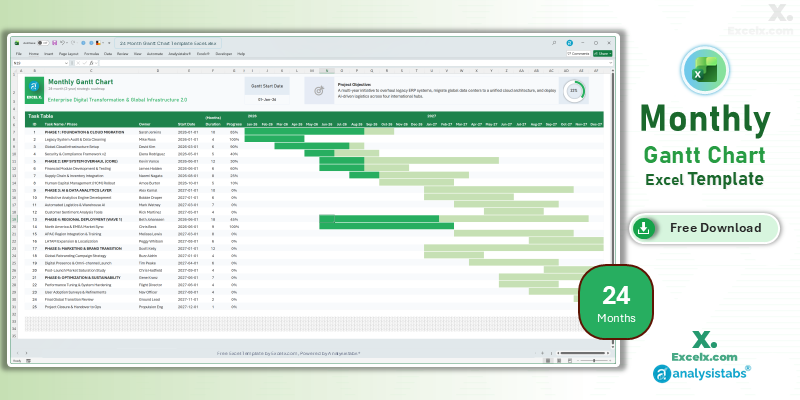
8. 24-Month Strategic Gantt
For multi-year initiatives spanning 730+ days. Handles long-duration tasks across years.
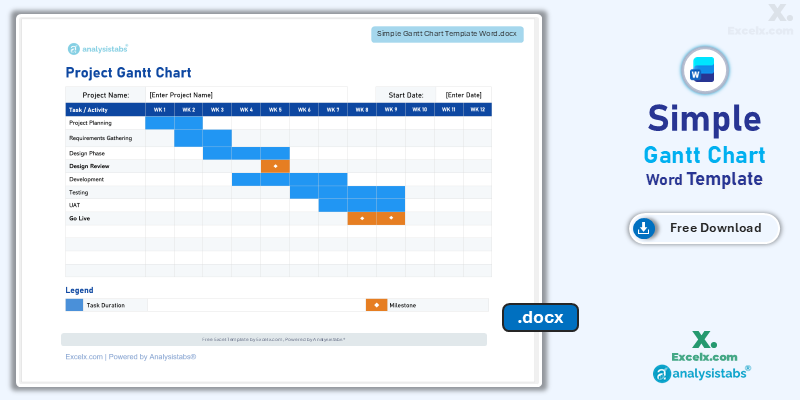
9. Gantt Chart for Word
Professional layout for formal documentation and print-ready schedules.
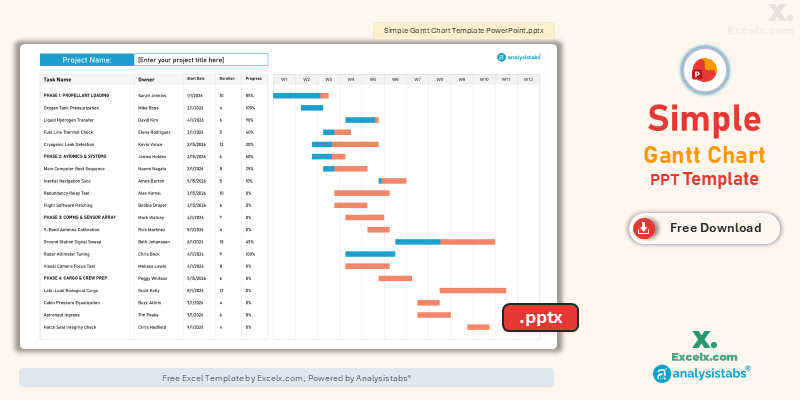
10. Gantt Chart for PowerPoint
High-contrast slides for board-level presentations and status meetings.
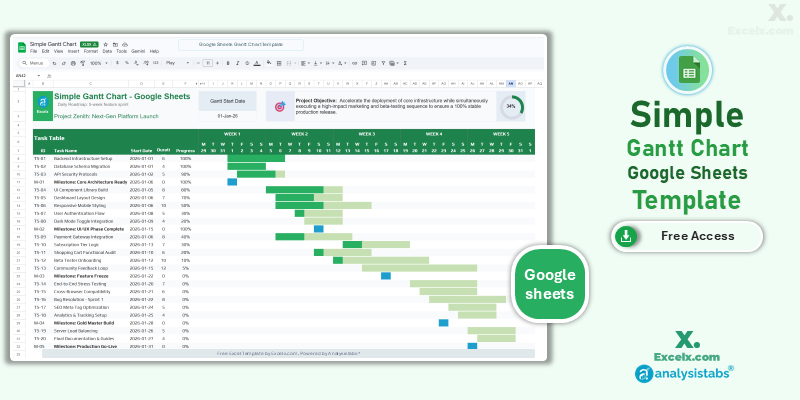
11. Google Sheets Version
Real-time collaborative editing with 24/7 cloud access for remote teams.
Get all free PM templates delivered to your inbox
How to Customize Your Gantt Chart Template
-
Update Project TitleEnter your specific project name in cell C3 to customize the header of the chart.
-
Define Project ObjectiveState your project goals in the Project Objective field to keep your team aligned.
-
Set Gantt Start DateModify the start date cell to automatically shift the timeline and calendar dates for the entire roadmap.
-
Input Your TasksAdd and track up to 25 individual tasks or milestones within the Task Table.
-
Manage Task DetailsFor each row, specify Task Name, Start Date, Duration, and Progress percentage to update the visual bars.
-
Observe Protected AreasKeep sheets protected to avoid breaking automated logic. Unprotect for deeper customization.
Adding More Than 25 Tasks Without Breaking the Bars
The task table is protected so the automated formatting isn’t overwritten by accident. To extend it:
- Go to Review > Unprotect Sheet.
- Right-click the row number of your last task row and choose Insert. Inserting inside the existing range copies the formatting down; adding rows below the range does not.
- If the bars stop rendering on the new rows, open Home > Conditional Formatting > Manage Rules, choose This Worksheet, and extend the Applies to range to your new last row.
How the Gantt Chart Formulas Work
These templates draw their bars with conditional formatting rather than Excel’s chart engine, which is why they stay fast and never break when you reorder rows. Here is the logic running underneath, so you can audit or adapt it.
Calculating Task Duration in Calendar Days
Duration counts the start day itself, so the end date is subtracted from the start date and one day is added back:
= End_Date - Start_Date + 1Skipping Weekends with NETWORKDAYS
If your project only runs Monday to Friday, NETWORKDAYS excludes Saturdays and Sundays automatically:
= NETWORKDAYS(Start_Date, End_Date)To exclude public holidays as well, list those dates somewhere off to the side and pass the range as a third argument:
= NETWORKDAYS(Start_Date, End_Date, Holidays_Range)For a custom working week — a six-day week, or Friday–Saturday weekends — use NETWORKDAYS.INTL instead, where the second-to-last argument sets which days count as the weekend.
The Conditional Formatting Rule That Draws the Bars
Each timeline cell checks whether its own column date falls inside that row’s task window. If it does, the cell fills; if not, it stays blank:
= AND(Column_Date >= Start_Date, Column_Date <= End_Date)The progress bar is a second rule layered on top, comparing the same column date against the portion of the task already complete. That is why editing the “% Complete” column changes the shading without touching anything else.
Linking Dependent Tasks
To make one task start the day after another finishes — so pushing Phase 1 pushes everything after it — reference the predecessor’s end date directly:
= Predecessor_End_Date + 1For a working-day version that skips weekends, use WORKDAY instead:
= WORKDAY(Predecessor_End_Date, 1)Changing the Timeline Bar Colours
Open Home > Conditional Formatting > Manage Rules, select This Worksheet, pick the timeline rule and click Edit Rule > Format. Change the Fill colour there and every bar updates at once — you never need to recolour cells by hand.
Hourly & Daily Gantt Chart Templates
High-intensity projects require granular tracking. These versions are ideal for event management, production schedules, or daily shift planning.
Hourly Gantt Chart Template Excel
- Precision Planning: Manage tasks by the hour for maximum control during tight schedules.
- Shift Management: Track team shifts or resource handovers within a single 24-hour period.
- Time-Sensitive Bars: Automated conditional formatting highlights exactly which hour a task begins.
Daily Gantt Chart Template Excel
- Day-Level Granularity: See exactly what is happening every single day of the work week.
- Weekend Handling: Formulas include or skip weekends based on your project needs.
- Immediate Visuals: Timeline updates in real-time as you adjust daily task durations.
Weekly Gantt Chart Template for Agile Sprints
- Agile Sprint Tracking: Optimized for weekly stand-ups and sprint reviews.
- Dynamic Week Headings: Change your start date and all weekly column headers update automatically.
- Task Ownership: Dedicated columns to assign weekly responsibilities to specific team members.
Basic & Very Simple Gantt Chart Layouts
Two alternatives to the flagship template, for plans that are either more structured or less structured than a standard task list.
Basic Gantt Chart Template with WBS and Subtasks
Use this version when your plan has nested structure rather than a flat list of tasks. Every row carries a WBS number and a category, so phases, tasks, sub-tasks and milestones stay visually distinct.
- WBS Numbering: Hierarchical codes (1, 1.1, 1.1.1) let you decompose a phase into tasks and sub-tasks without losing track of where each item sits.
- Category Column: Tag each row as Phase, Task, Sub-Task or Milestone. Phase rows act as headers over the work beneath them.
- Fractional Durations: Supports part-day durations such as 0.5 or 1.5 for short review and approval steps.
- Milestone Markers: Zero-duration rows render as checkpoint markers instead of bars.
Very Simple Gantt Chart Template (No Calendar Dates)
This is the easiest layout to fill in, because it removes dates entirely. Instead of a start date, each task takes a start day number — Day 1, Day 4, Day 12 — plotted across a 31-day grid.
- No Dates Required: Useful when you know a project takes six weeks but not yet when it begins. Nothing needs rebuilding when the start date is finally fixed.
- No Weekend Logic: Because days are counted rather than dated, there are no weekends or holidays to configure.
- Fast Setup: Task name, start day, duration, progress. Four columns, and the timeline is done in about a minute.
- Portable Plans: The same sheet works as a repeatable 30-day template for onboarding plans, course schedules, or sprint outlines.
Monthly Gantt Chart Templates for Long-Term Roadmaps
Bird’s-eye view for departmental planning and resource allocation across months and years.
12-Month Annual Gantt Chart
- Annual Strategy Mapping: Track quarterly goals across a full 12-month period.
- High-Level Roadmaps: Perfect for long-term deliverables without clutter.
- Resource Allocation: Identify months where multiple project phases overlap.
24-Month Strategic Gantt Chart
- Long-Term Logic: Automated bars for dates spanning 730+ days.
- Strategic Milestones: Track multi-year goals on one roadmap.
- Date Flexibility: Supports long-duration tasks spanning correct months and years.
Gantt Chart Templates for Word, PPT & Google Sheets
Not everyone works in spreadsheets. These versions are perfect for presentations, formal documentation, and collaborative access.
PowerPoint Version
High-contrast slides for board-level presentations and project status meetings.
Google Sheets Version
Real-time collaborative editing with 24/7 cloud access for remote teams.
For Gantt chart templates in all formats (Excel, Word, PowerPoint, PDF, Google Sheets), visit Analysistabs.com/templates/gantt-chart/
Compatibility: Excel Versions, Mac, iPad & Google Sheets
Every file is a standard .xlsx workbook with no macros, no VBA and no add-ins, which keeps it portable across platforms.
- Windows: Microsoft 365, Excel 2024, 2021, 2019, 2016, 2013 and 2010. NETWORKDAYS and conditional formatting are available in all of these.
- Mac: Excel for Mac 2016 and later. Conditional formatting rules carry across unchanged.
- iPad and Excel Mobile: Bars display correctly and you can edit dates and progress. Editing conditional formatting rules requires the desktop app.
- Google Sheets: Use the dedicated Google Sheets version for the cleanest result. The .xlsx files also import, though a few fill colours may shift slightly on conversion.
- LibreOffice and OpenOffice: Files open and the bars render. Some date formats may need resetting to your local convention.
- Older .xls format: Save a copy via File > Save As > Excel 97-2003 if you need one. Conditional formatting is preserved, but the legacy format caps rules per sheet, so extending very large task tables may hit that limit.
Printing a Multi-Month Schedule
Long timelines run wider than one sheet. Set Page Layout > Orientation > Landscape, then Scale to Fit > Width: 1 page, and use Print Titles to repeat the task name column on every printed page so the bars stay readable.
Best Practices for Excel Gantt Charts
Use a consistent date format to ensure Excel’s formulas calculate durations correctly. Set your regional format in Excel’s Format Cells option.
Assign a specific Owner to every task. This increases accountability and reduces project lag.
Use the color-coded “% Complete” bars to identify bottlenecks during weekly stand-up meetings. Green = on track, yellow = at risk, red = overdue.
Mixing week-long phases with two-hour tasks in the same list makes the chart unreadable. If you need both, use the Basic template’s WBS layout so the detail nests under its parent phase.
Frequently Asked Questions
Is this Gantt chart template really free?
Yes. All 11 templates (Excel, Word, PPT, and Google Sheets) are completely free. Download and use for any project — personal or commercial.
Which Gantt chart template should I choose?
Most projects: Simple (#1). Events and shifts: Hourly (#2). Agile sprints: Weekly (#4). Plans with subtasks and WBS numbering: Basic (#5). No fixed dates yet: Very Simple (#6). Annual planning: 12-Month (#7). Multi-year roadmaps: 24-Month (#8).
How do I make the Gantt chart skip weekends?
Use NETWORKDAYS instead of a plain date subtraction: =NETWORKDAYS(Start_Date, End_Date). This counts Monday to Friday only. To exclude public holidays as well, list those dates in a spare column and pass that range as the third argument. For a non-standard working week, use NETWORKDAYS.INTL.
How do I add my company holidays to the calculation?
Put your holiday dates in a spare column — say Z1:Z10 — then reference that range: =NETWORKDAYS(Start_Date, End_Date, Z1:Z10). Those days are then excluded from every duration.
How do I change the colour of the timeline bars?
Open Home > Conditional Formatting > Manage Rules, choose “This Worksheet”, select the timeline rule, then Edit Rule > Format and pick a new Fill colour. Every bar updates at once.
How many tasks can I add?
Default templates support up to 25 tasks. Unprotect the sheet, then insert rows inside the existing range so the formatting copies down. If bars don’t appear on new rows, extend the “Applies to” range in Manage Rules. For 100+ tasks, see the Premium version.
Can I link tasks so one starts after another finishes?
Yes. Set the successor’s start date to =Predecessor_End_Date + 1, or =WORKDAY(Predecessor_End_Date, 1) if you want to skip weekends. Delaying the earlier task then pushes everything after it automatically.
What Excel versions are compatible?
All files work with Microsoft 365, Excel 2024, 2021, 2019, 2016, 2013 and 2010 on Windows, and Excel 2016 or later on Mac. No macros required.
Do these work in Google Sheets?
Yes. We provide a dedicated Google Sheets version. The Excel .xlsx files also open in Google Sheets, though a few fill colours may shift slightly during conversion.
Can I change the date format?
Yes. Select date columns and use Format Cells to switch to your preferred regional display without breaking the Gantt bars.
Do these templates use macros or VBA?
No. Every timeline is drawn with conditional formatting only. That means no security warnings on open, no “enable content” prompt, and no broken files when they’re emailed or uploaded to cloud storage.
Can I use these for professional project management?
Absolutely. They include professional-grade features like automated progress tracking and conditional formatting.
Can I get a more advanced version?
Yes. For resource leveling, automated dashboards, and dependency tracking, visit our premium collection at Analysistabs.org.
Related Templates
Project Plan Templates
9 free templates with Gantt chart, task tracking, and resource allocation.
Project Schedule
Detailed timeline with milestones and date tracking.
WBS Template
Hierarchical task decomposition with auto-numbering.
Multi-Project Tracker
Monitor multiple projects from one dashboard.
Project Charter
Define scope, stakeholders, and objectives.
RACI Matrix
Assign roles and responsibilities across tasks.
Ready for Professional Project Power?
Need resource leveling, dependency tracking, and workload capacity tools? Check out our Premium Project Templates.
I like the clean timeline and clear visual progress in the Basic Gantt Chart with WBS & Subtasks. It works well for status discussions.
Hi Celina,
Thank you so much for the feedback! We designed the Basic Gantt Chart specifically to make project timelines and progress tracking clean, clear, and presentation-ready. We are delighted to hear that it is working so effectively for your status meetings and discussions. Best of luck with your projects! – PNRao